























Analytics and monitoring
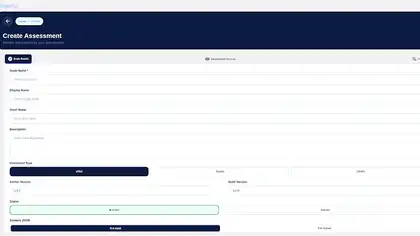
Operational dashboards turn system activity into clear, actionable insights.
Case study — Digital Experience
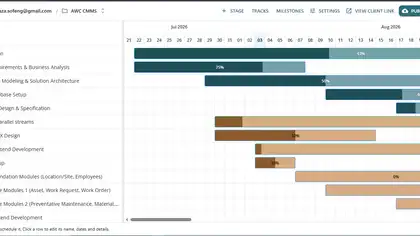
Make Your Customized Gantt Chart
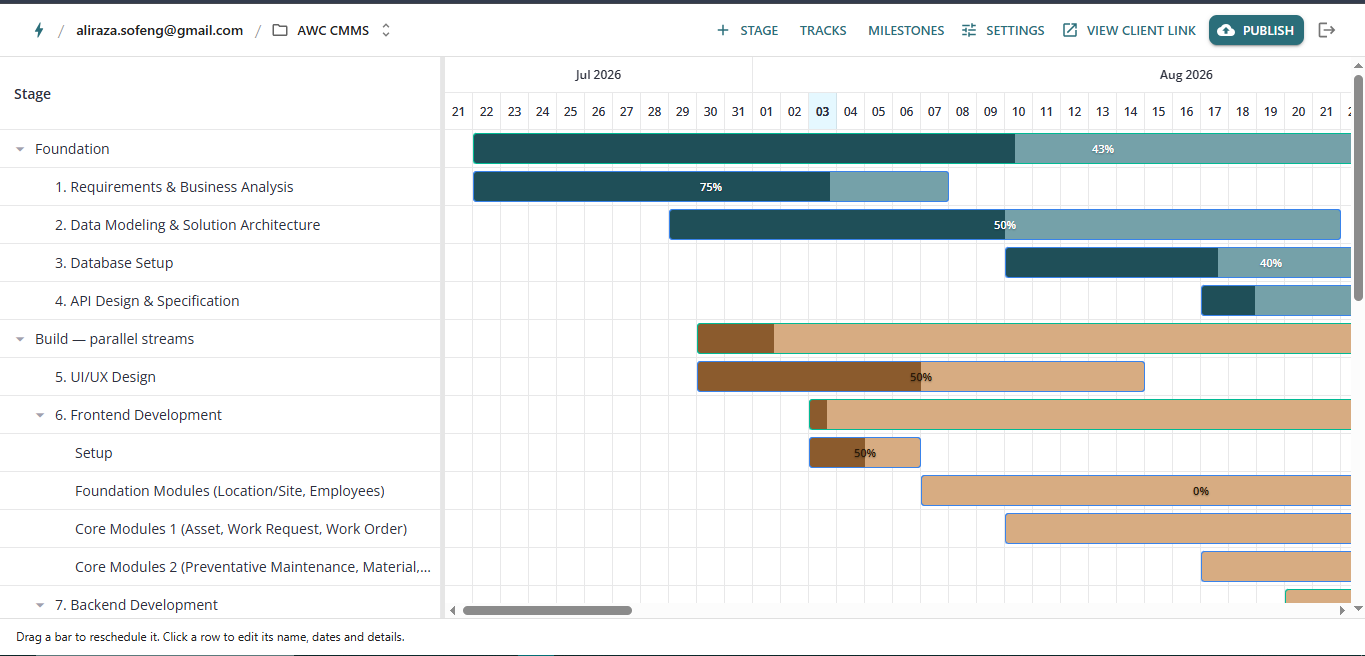
Make Your Customized Gantt Chart
Gave the team a clear, shareable visual timeline that improved planning and communication, and turned into a reusable tool for future projects instead of a one-off fix.
Existing project management tools' Gantt charts were too rigid, they didn't allow the level of customization (styling, task grouping, dependencies, timelines) needed for this specific project, making it hard to communicate project schedules clearly to stakeholders.
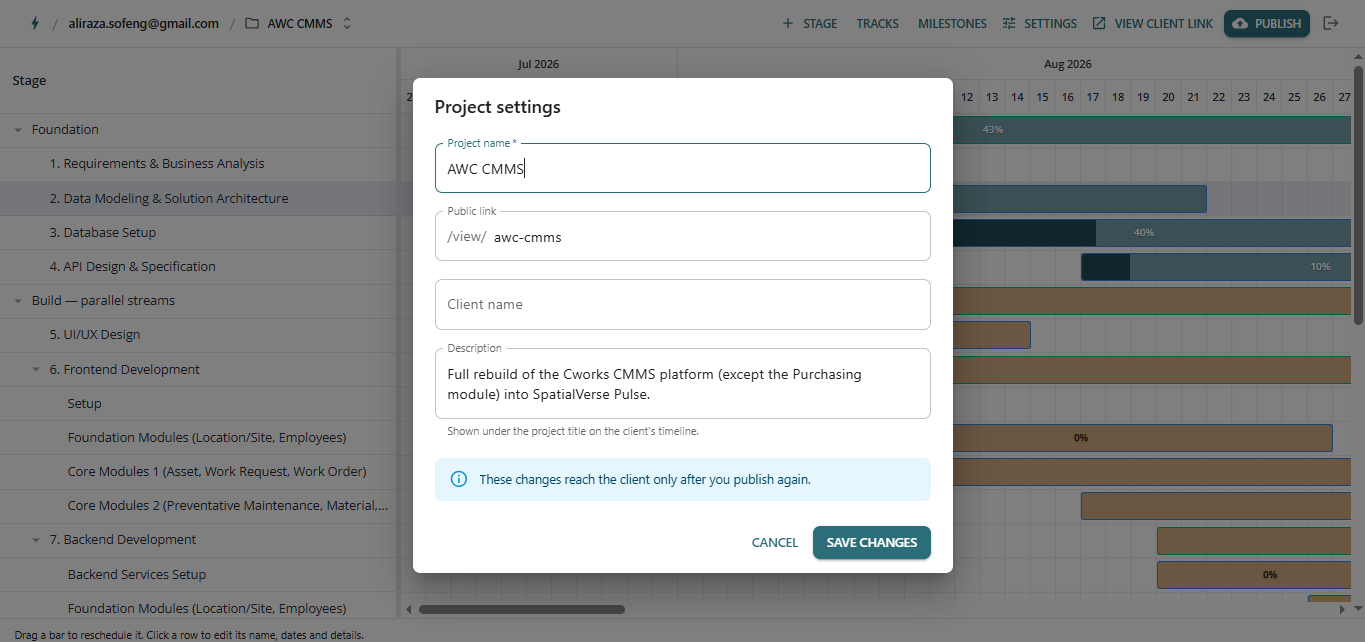
Built a custom Gantt chart tool from scratch that lets users create, edit, and visualize project timelines with flexible task bars, dependencies, milestones, and grouping, tailored exactly to the project's workflow instead of forcing it into a generic template.
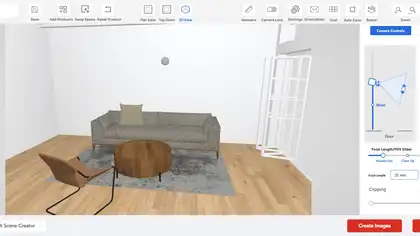
The experience combines Monitoring, 2D Web & UI, Creative Websites, Saailverse Product in a responsive system designed to stay clear, fast, and reliable across devices.
Gave the team a clear, shareable visual timeline that improved planning and communication, and turned into a reusable tool for future projects instead of a one-off fix.
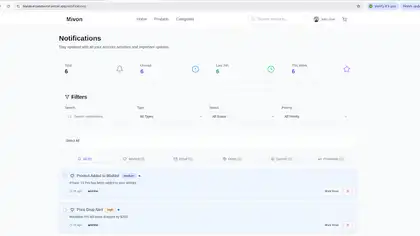
Operational dashboards turn system activity into clear, actionable insights.
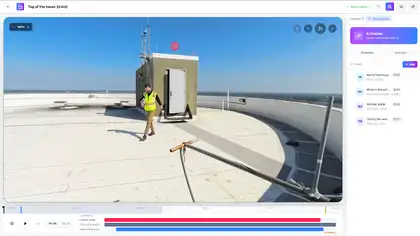
Interactive timelines help users plan work, adjust schedules, and understand progress clearly.
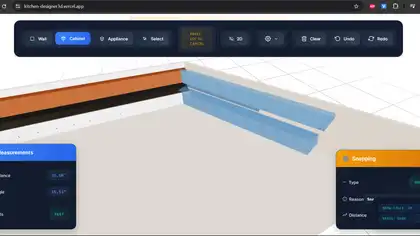
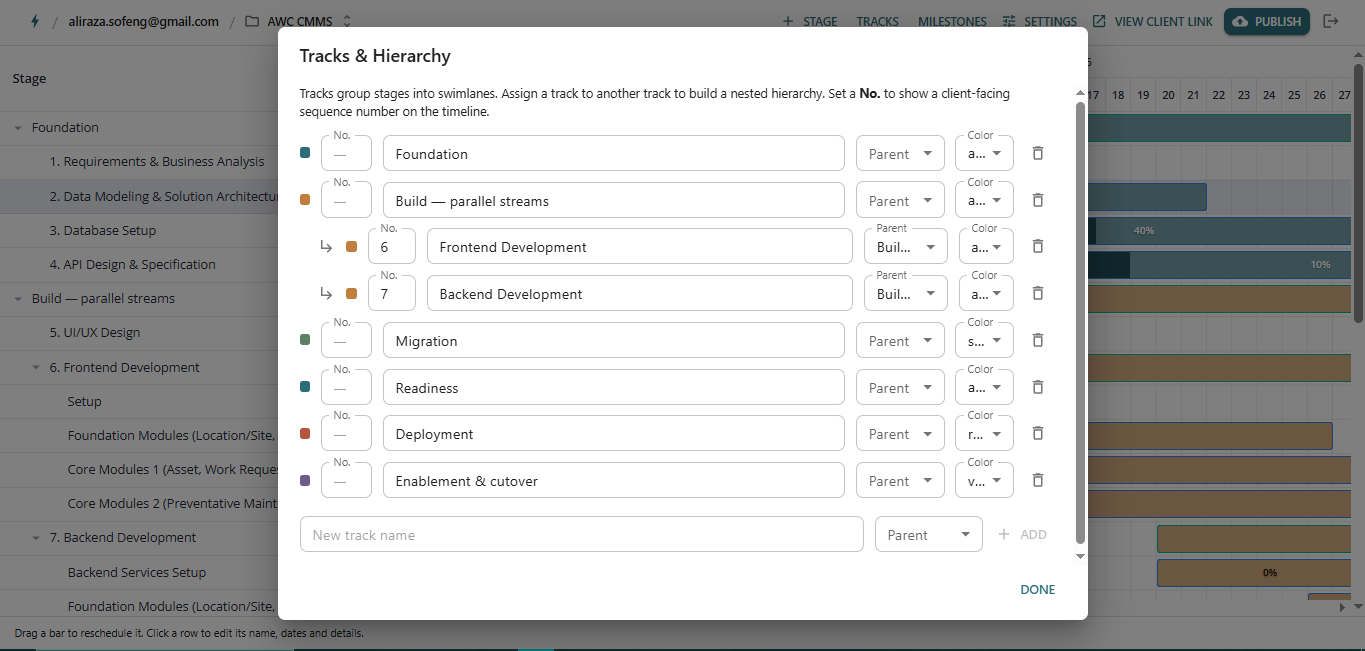
Dependency controls make relationships between tasks, options, or system states easy to manage.
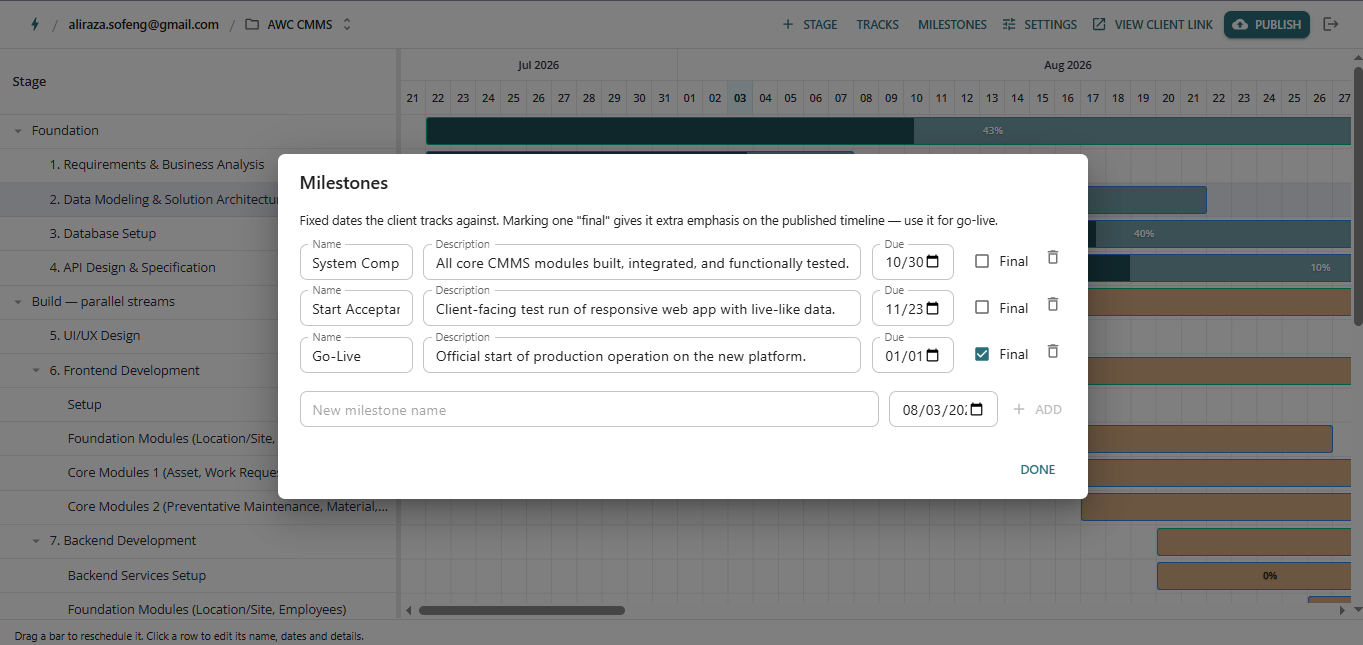
Milestone tracking highlights important stages and keeps progress visible throughout the workflow.
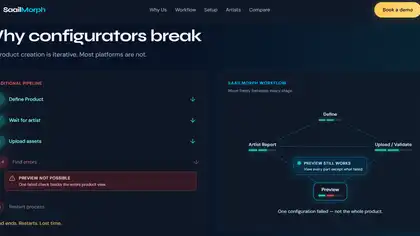
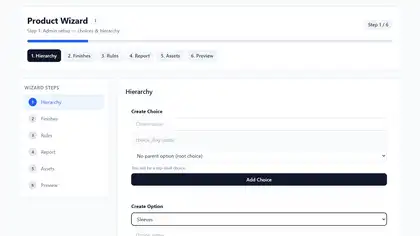
Guided workflows reduce repetitive work and keep complex processes consistent.
Clear visualizations turn complex data into information users can understand and act on.
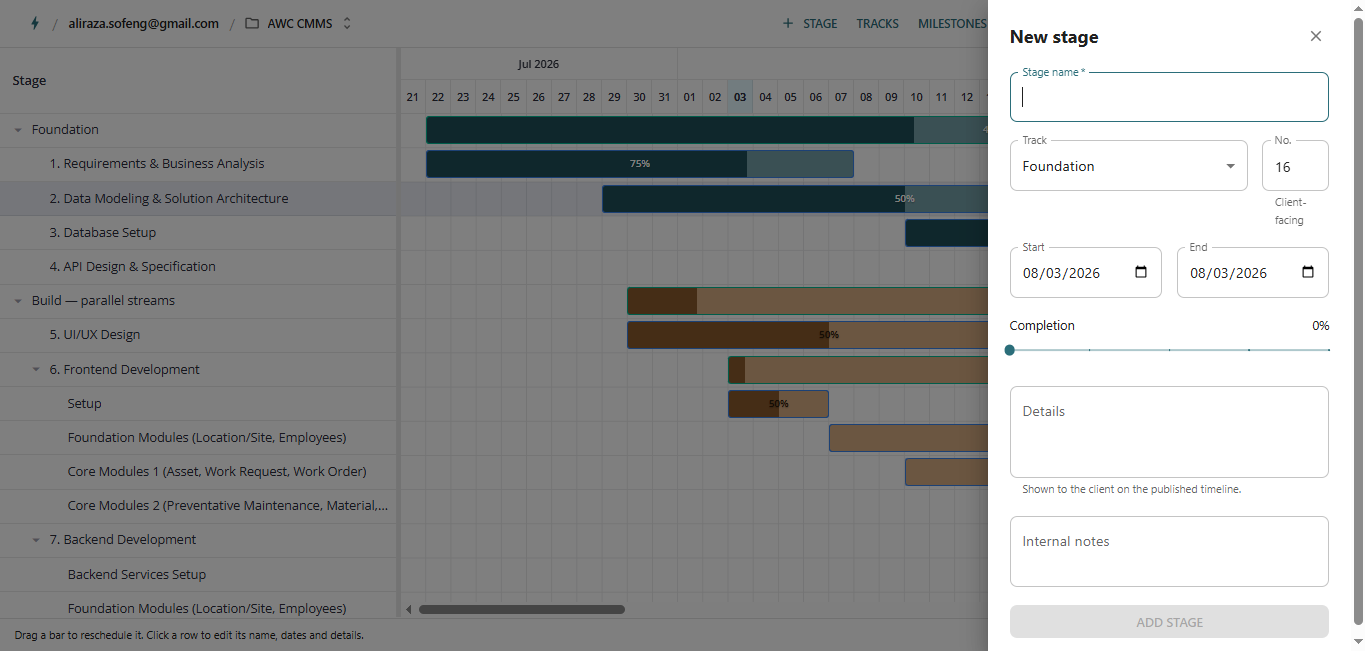
Gave the team a clear, shareable visual timeline that improved planning and communication, and turned into a reusable tool for future projects instead of a one-off fix.
 Project TeamSaailverse case study
 Next ProjectTariq Masood Law Associates (TMLA) — Law Firm WebsiteData Visualization