

















Analytics and monitoring
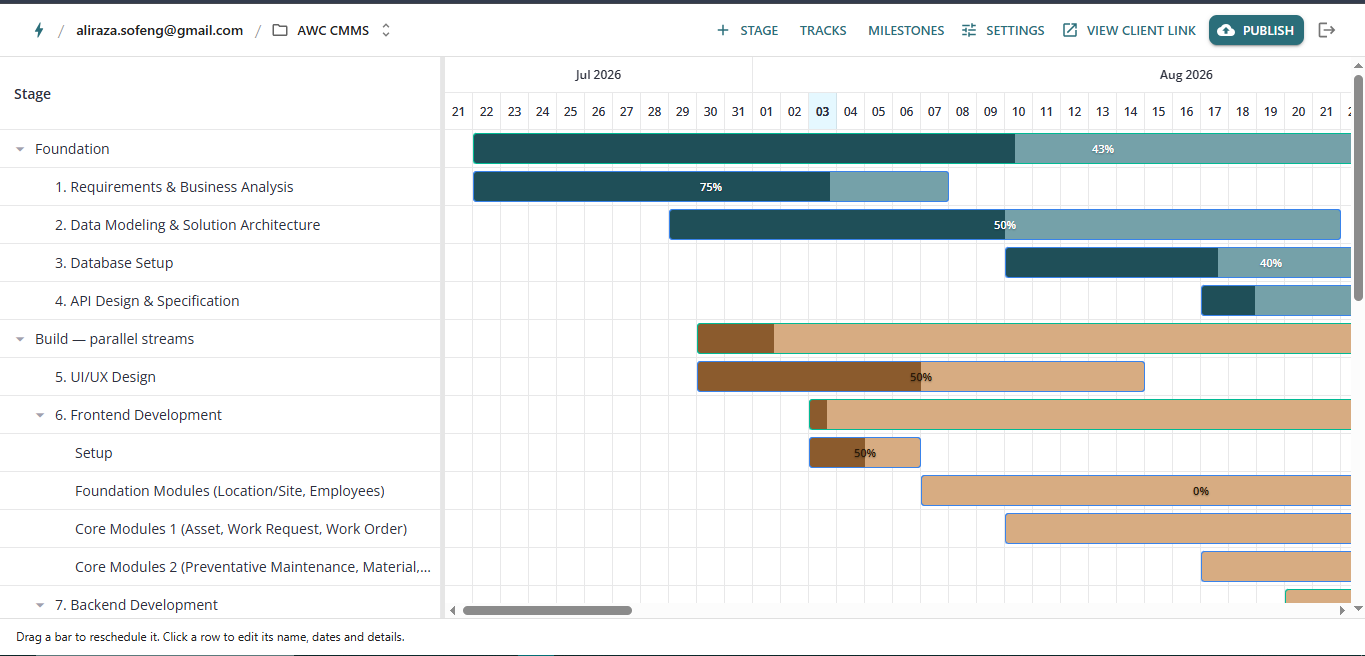
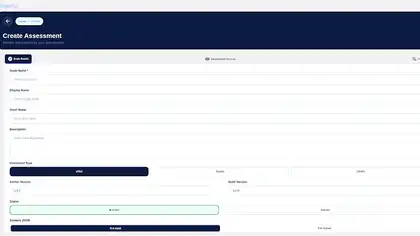
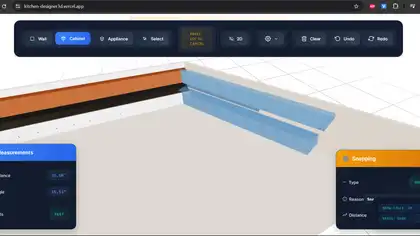
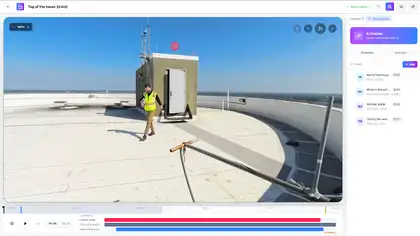
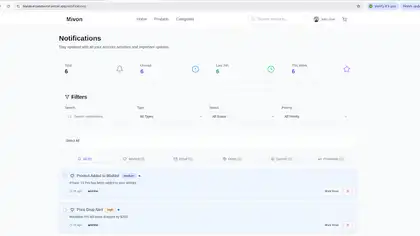
Operational dashboards turn system activity into clear, actionable insights.
Case study — Digital Experience
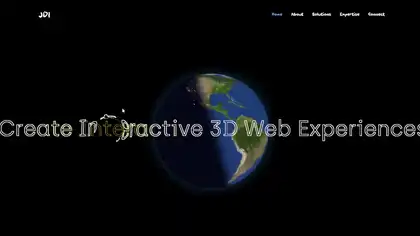
Interactive globe visualization making global biotech research easy to explore
Interactive globe visualization making global biotech research easy to explore
Goal achieved in 1 day. Responsive UI across mobile, tablet, and desktop. Instant geographic context for global biotech research.
Complex biotech research data spread across the world was difficult for stakeholders to discover and understand at a glance.
We created a responsive website in one day that uses globe.gl to display markers over research locations, with hover pop-ups summarizing each study.
The experience combines React, Three.js, Vercel, TypeScript in a responsive system designed to stay clear, fast, and reliable across devices.
Goal achieved in 1 day. Responsive UI across mobile, tablet, and desktop. Instant geographic context for global biotech research.
Operational dashboards turn system activity into clear, actionable insights.
The interface adapts to supported screen sizes for a consistent experience across devices.
Analytics is built into the system as a core user-facing capability.
Goal achieved in 1 day. Responsive UI across mobile, tablet, and desktop. Instant geographic context for global biotech research.
 Project TeamSaailverse case study