


















Interactive 3D visualization
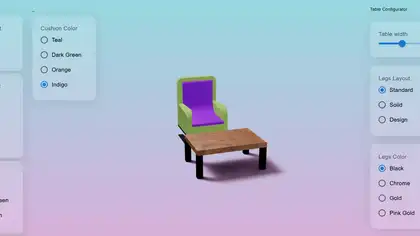
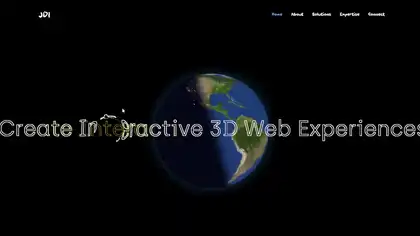
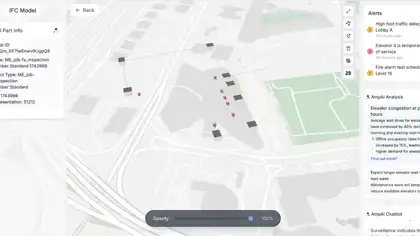
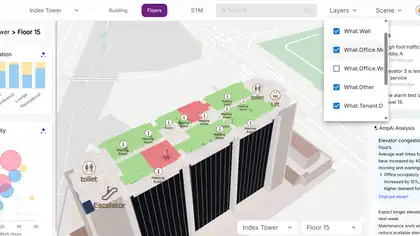
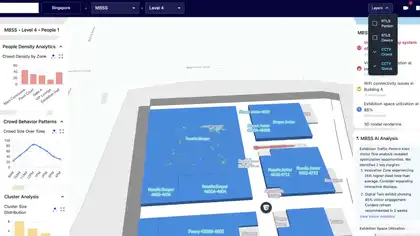
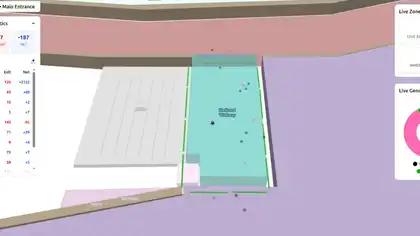
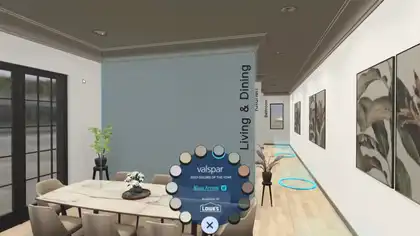
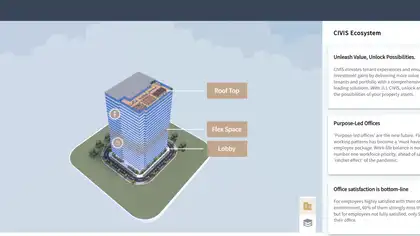
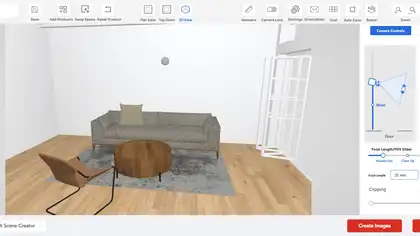
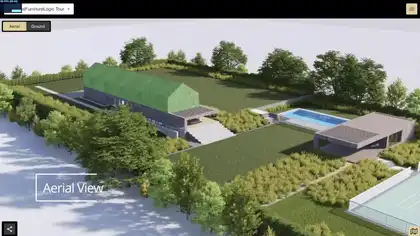
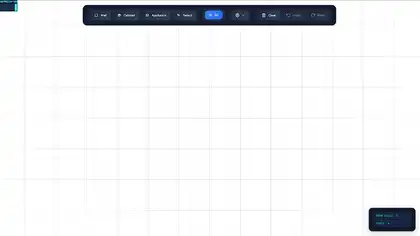
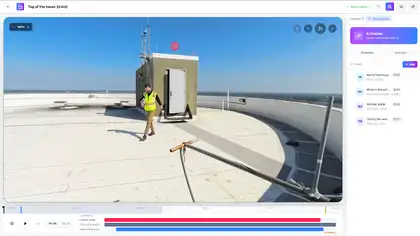
Users can explore and interact with rich 3D content directly in the browser.
Case study — Digital Experience
Real-time IoT monitoring platform for the Singapore Flyer
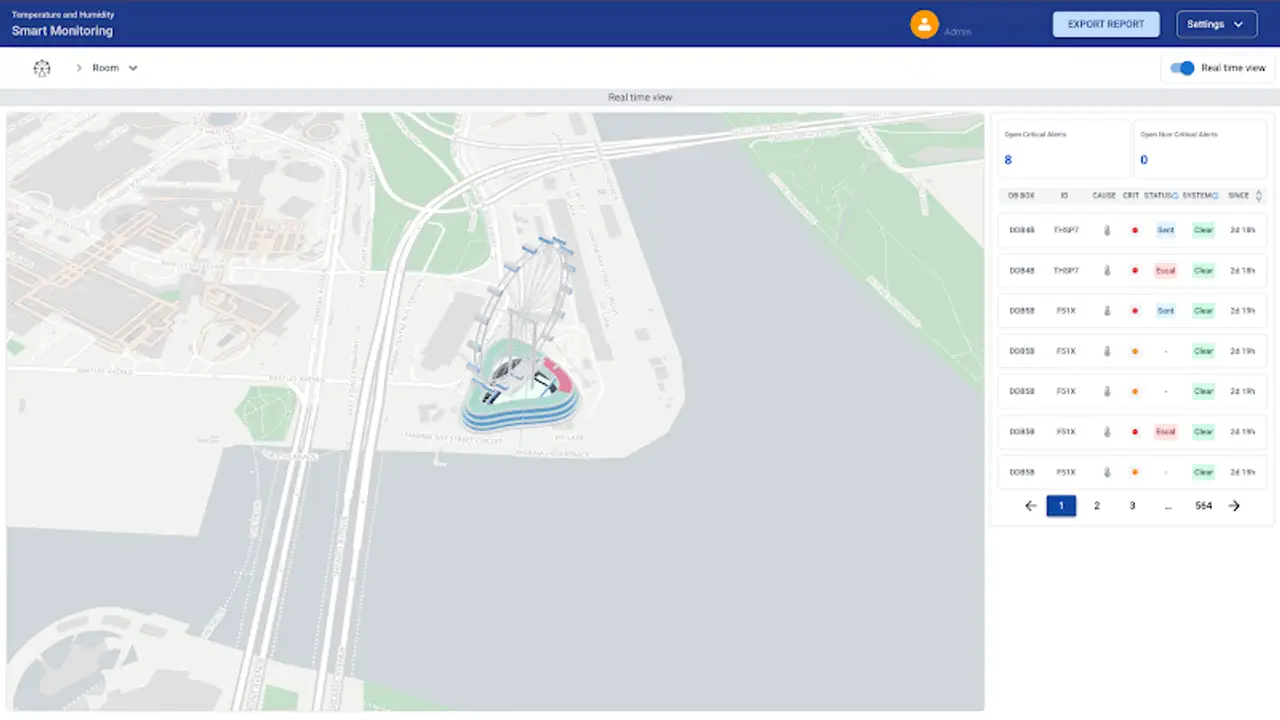
Real-time IoT monitoring platform for the Singapore Flyer
Delivered a scalable, responsive dashboard enabling seamless real-time monitoring and administrative control, improving operational visibility for one of Singapore's landmark attractions.
The Singapore Flyer operations team needed unified real-time visibility into sensors, alerts, and building systems across a landmark attraction.
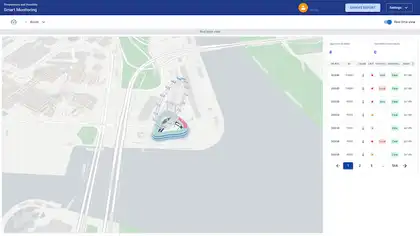
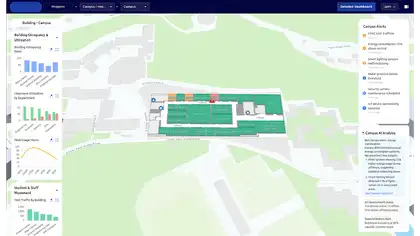
We built a scalable dashboard integrating 3D building visualization, interactive maps, live sensor data, alert management, device control, user access, and multi-format exports.
The experience combines Vue 3, TypeScript, Three.js, MapLibre in a responsive system designed to stay clear, fast, and reliable across devices.
Delivered a scalable, responsive dashboard enabling seamless real-time monitoring and administrative control, improving operational visibility for one of Singapore's landmark attractions.
Users can explore and interact with rich 3D content directly in the browser.
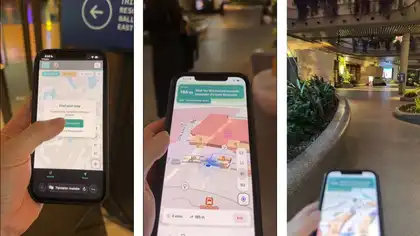
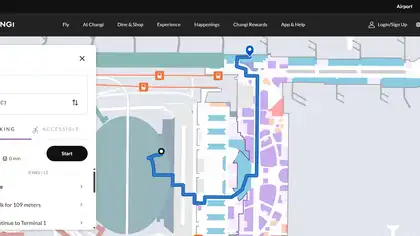
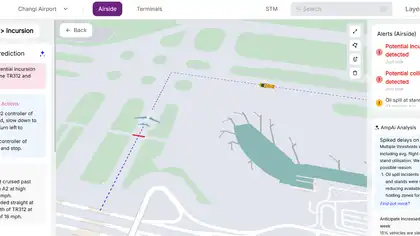
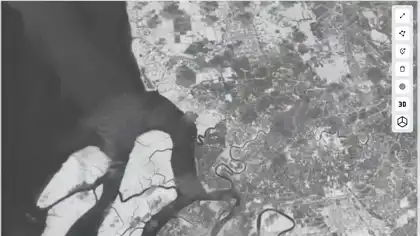
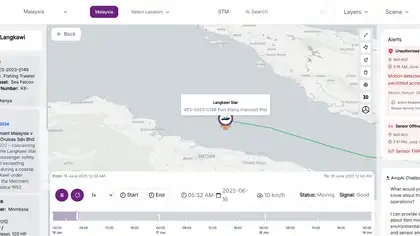
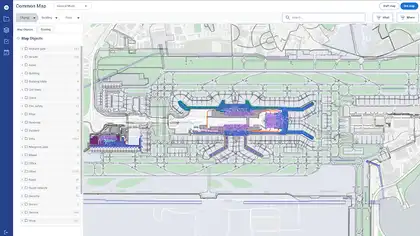
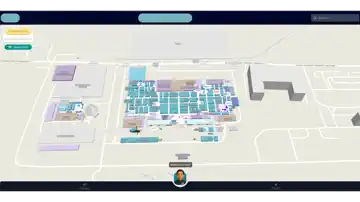
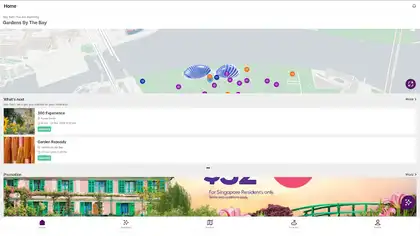
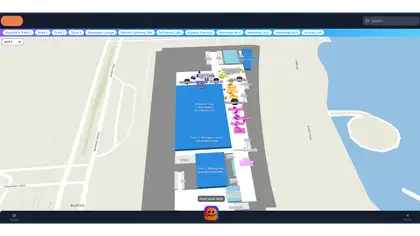
Spatial information is presented through an interactive map built for intuitive exploration.
Live information keeps the experience current and supports timely decisions.
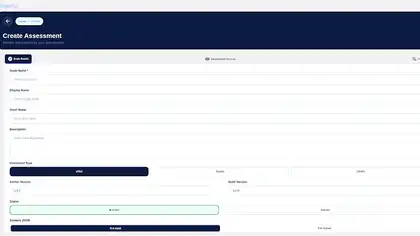
Secure account access supports personalized and protected user journeys.
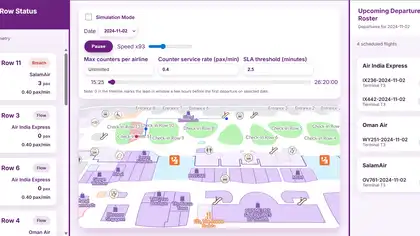
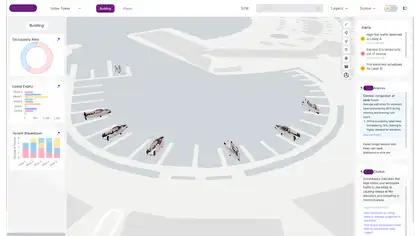
Operational dashboards turn system activity into clear, actionable insights.
Timely alerts keep users informed about important changes, risks, and required actions.
Delivered a scalable, responsive dashboard enabling seamless real-time monitoring and administrative control, improving operational visibility for one of Singapore's landmark attractions.
 Project TeamSaailverse case study
 Next ProjectAirOps 360 — 3D Mapping & Analytics PlatformData Visualization