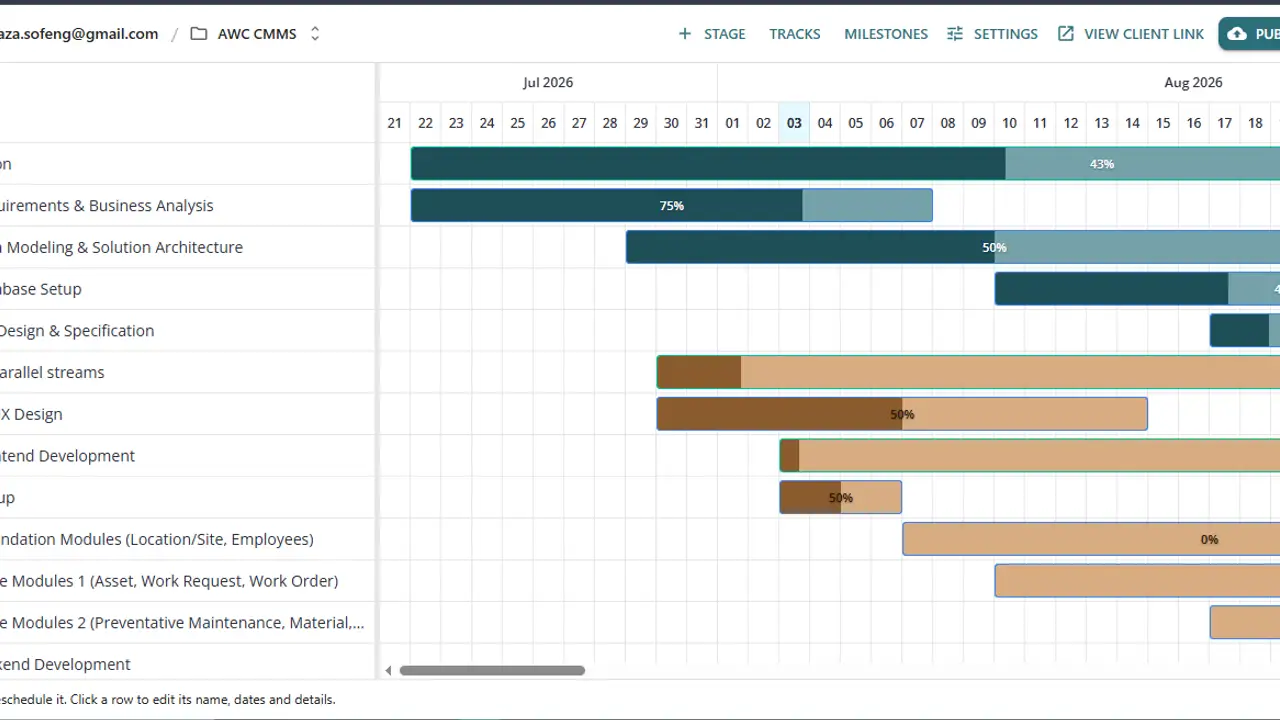












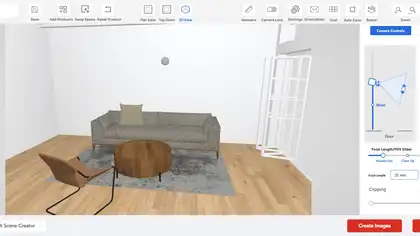
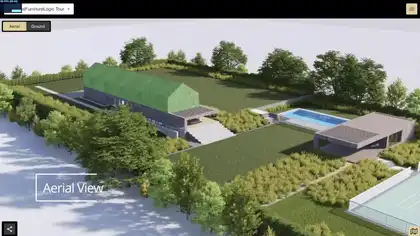



Interactive mapping
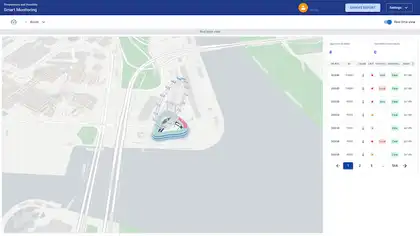
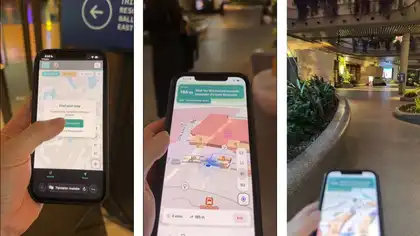
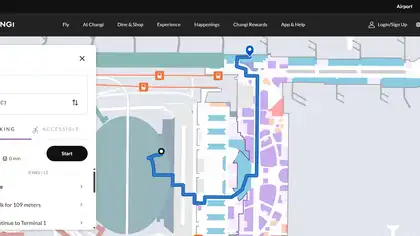
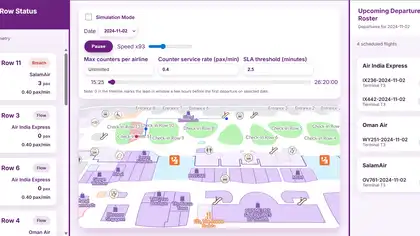
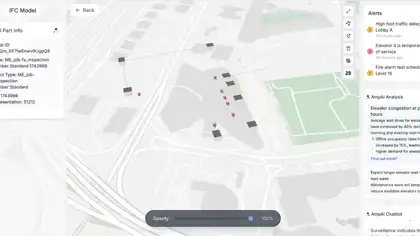
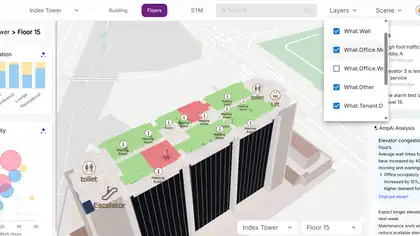
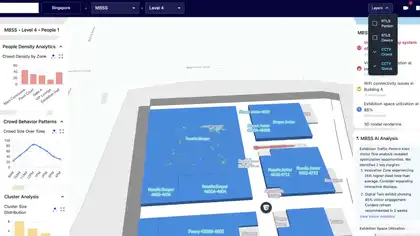
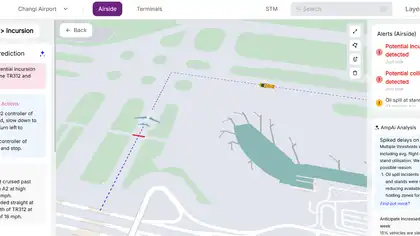
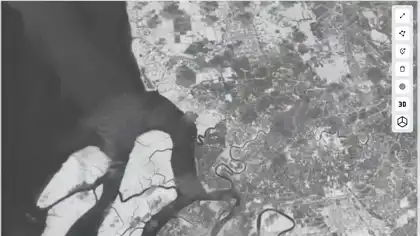
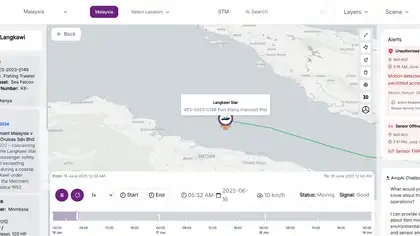
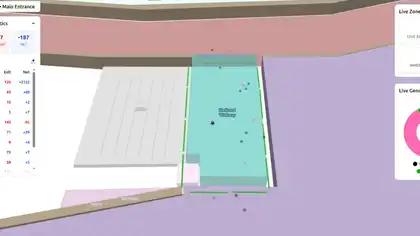
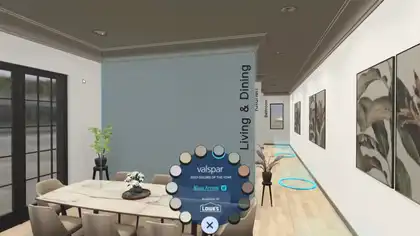
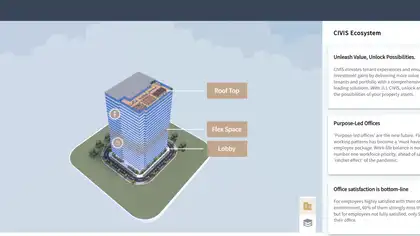
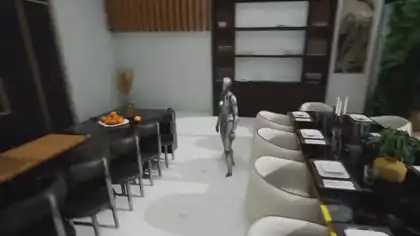
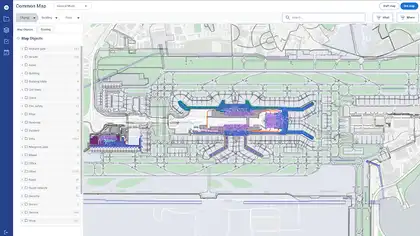
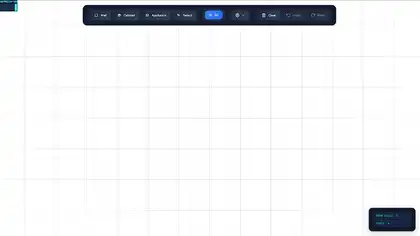
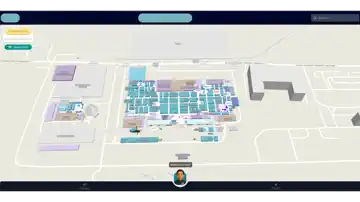
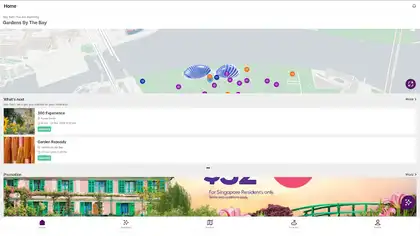
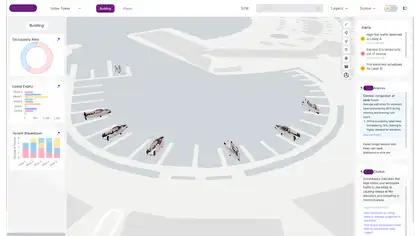
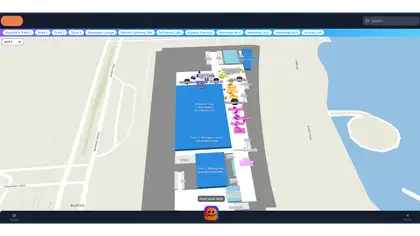
Spatial information is presented through an interactive map built for intuitive exploration.
Case study — Digital Experience
Advanced geospatial asset playback and timeline visualization platform for real-time operational monitoring.
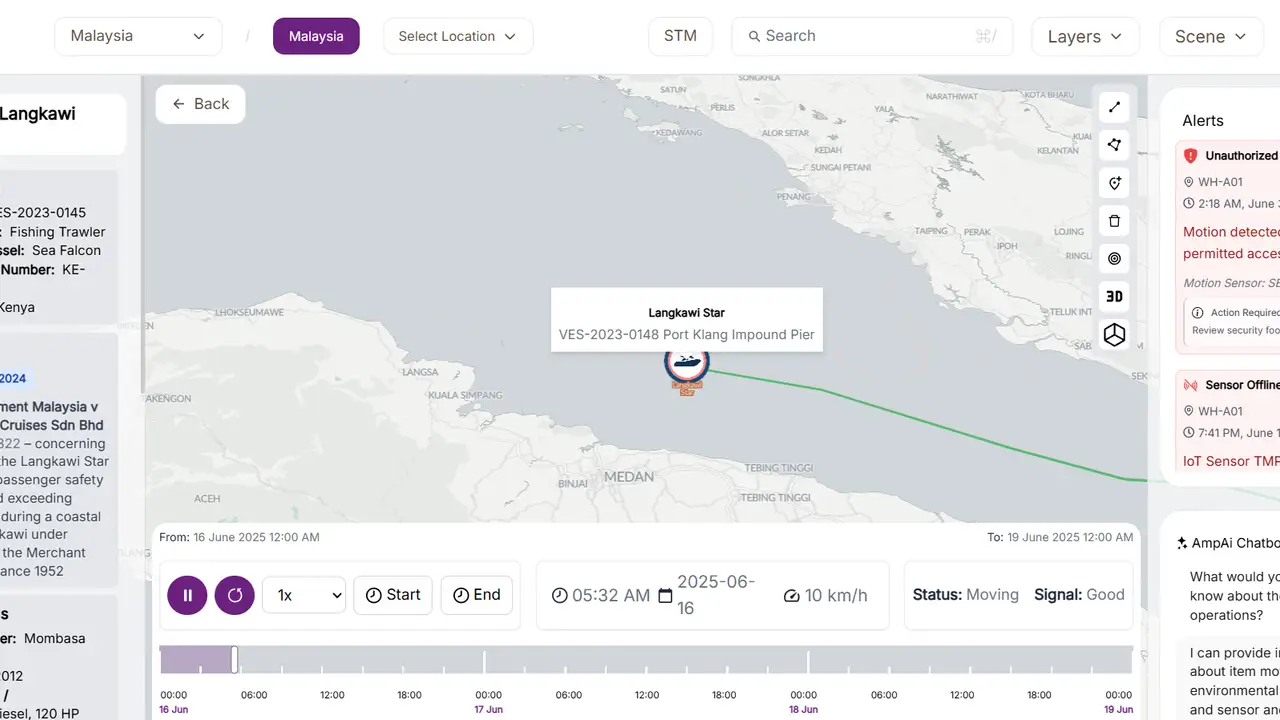
Advanced geospatial asset playback and timeline visualization platform for real-time operational monitoring.
Improved operational visibility for moving asset monitoring. Enabled temporal playback and historical route analysis. Enhanced situational awareness for logistics and operations teams. Reduced analysis complexity through interactive geospatial timelines. Created scalable visualization workflows for high-frequency tracking data.
Organizations managing moving assets such as vehicles, aircraft, logistics fleets, or operational equipment struggle to analyze historical movement patterns and operational timelines using static maps or disconnected tracking systems. Existing systems often lack smooth playback, temporal visualization, and scalable geospatial analytics.
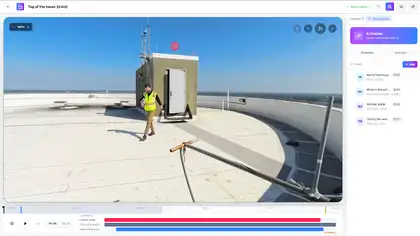
Developed an advanced timeline-driven geospatial visualization system on top of MapLibre GL, enabling organizations to replay, analyze, and monitor asset movements across time directly on an interactive map. The platform supports animated asset playback, temporal filtering, route visualization, and synchronized timeline controls for operational analysis.
The experience combines MapLibre, TypeScript, React, WebGL in a responsive system designed to stay clear, fast, and reliable across devices.
Improved operational visibility for moving asset monitoring. Enabled temporal playback and historical route analysis. Enhanced situational awareness for logistics and operations teams. Reduced analysis complexity through interactive geospatial timelines. Created scalable visualization workflows for high-frequency tracking data.
Spatial information is presented through an interactive map built for intuitive exploration.
Live information keeps the experience current and supports timely decisions.
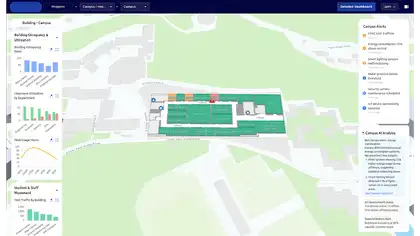
Operational dashboards turn system activity into clear, actionable insights.
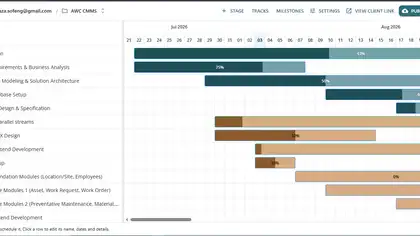
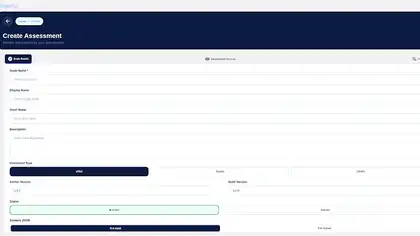
Structured forms simplify data collection and guide users through complete submission workflows.
Monitoring is built into the system as a core user-facing capability.
Analytics is built into the system as a core user-facing capability.
Improved operational visibility for moving asset monitoring. Enabled temporal playback and historical route analysis. Enhanced situational awareness for logistics and operations teams. Reduced analysis complexity through interactive geospatial timelines. Created scalable visualization workflows for high-frequency tracking data.
 Project TeamSaailverse case study
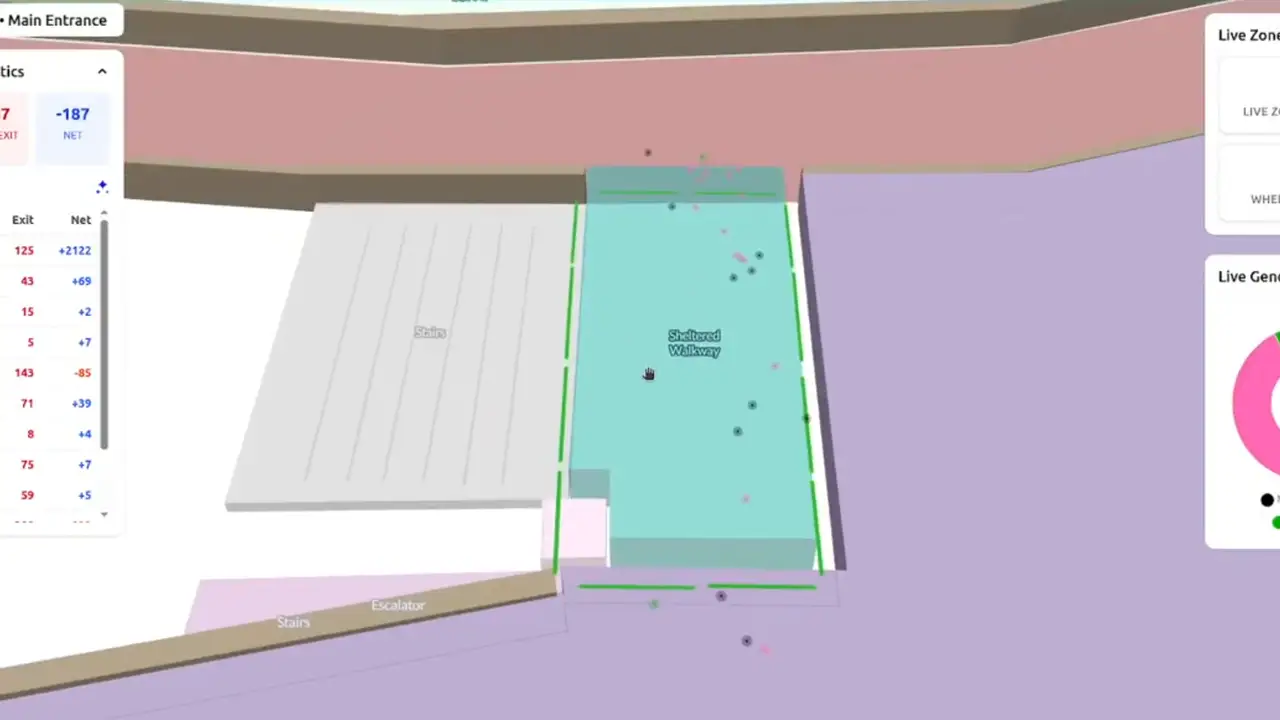 Next ProjectStadium — Real-Time Crowd Intelligence PlatformData Visualization