











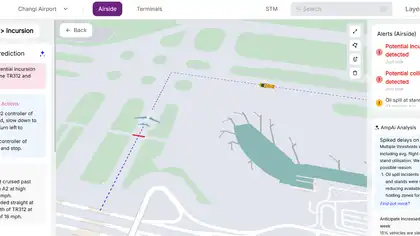
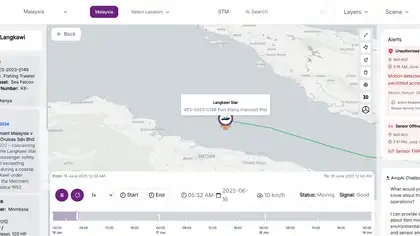
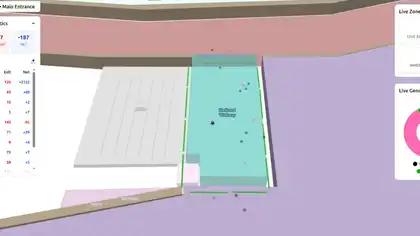


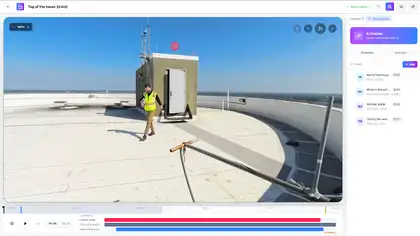

Interactive mapping
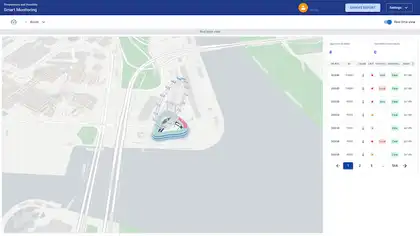
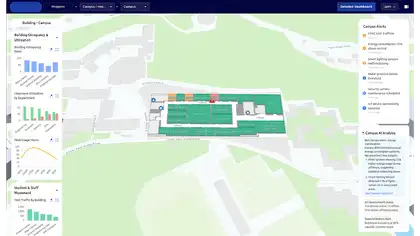
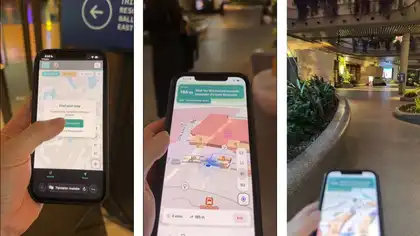
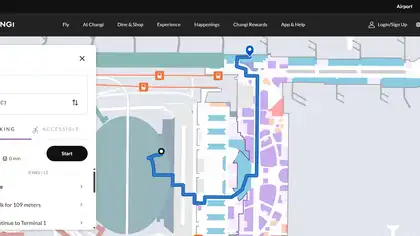
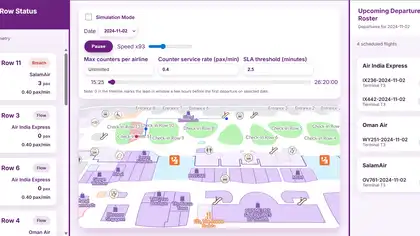
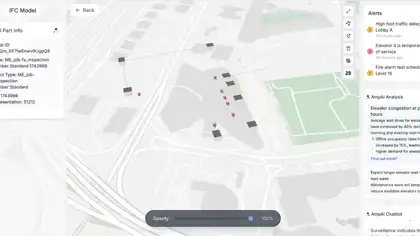
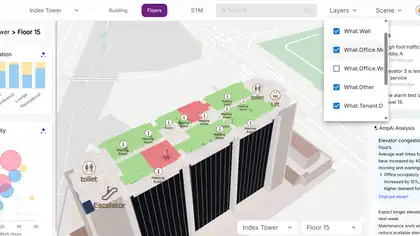
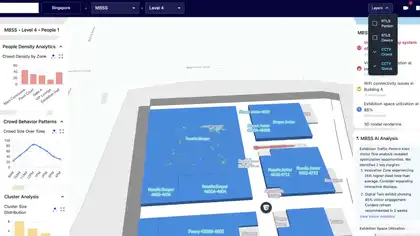
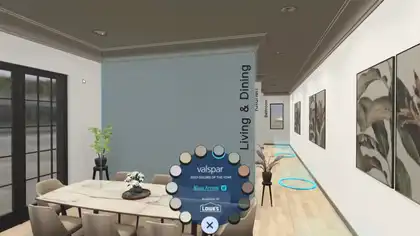
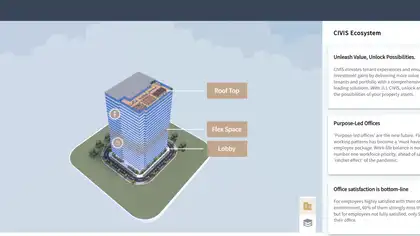
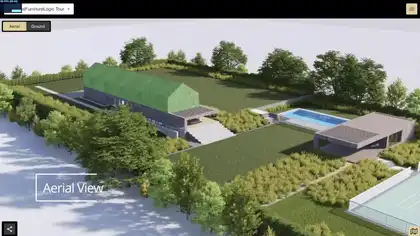
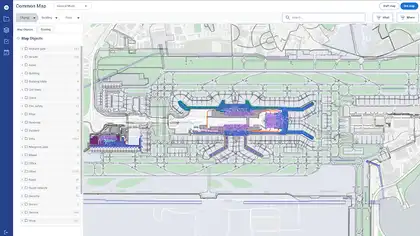
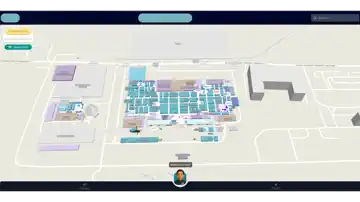
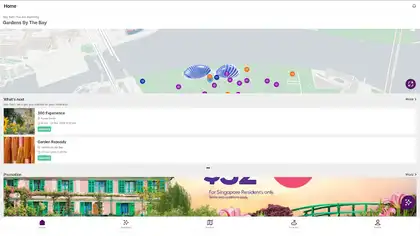
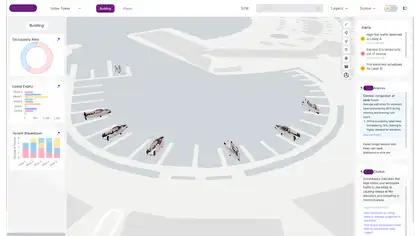
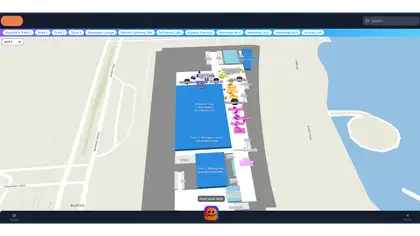
Spatial information is presented through an interactive map built for intuitive exploration.
Case study — Digital Experience
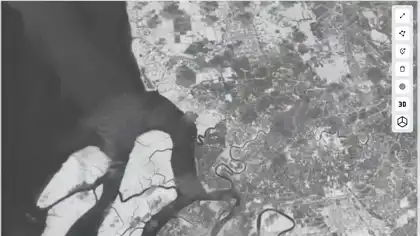
High-performance Cloud Optimized GeoTIFF visualization platform with dynamic geospatial layer management.
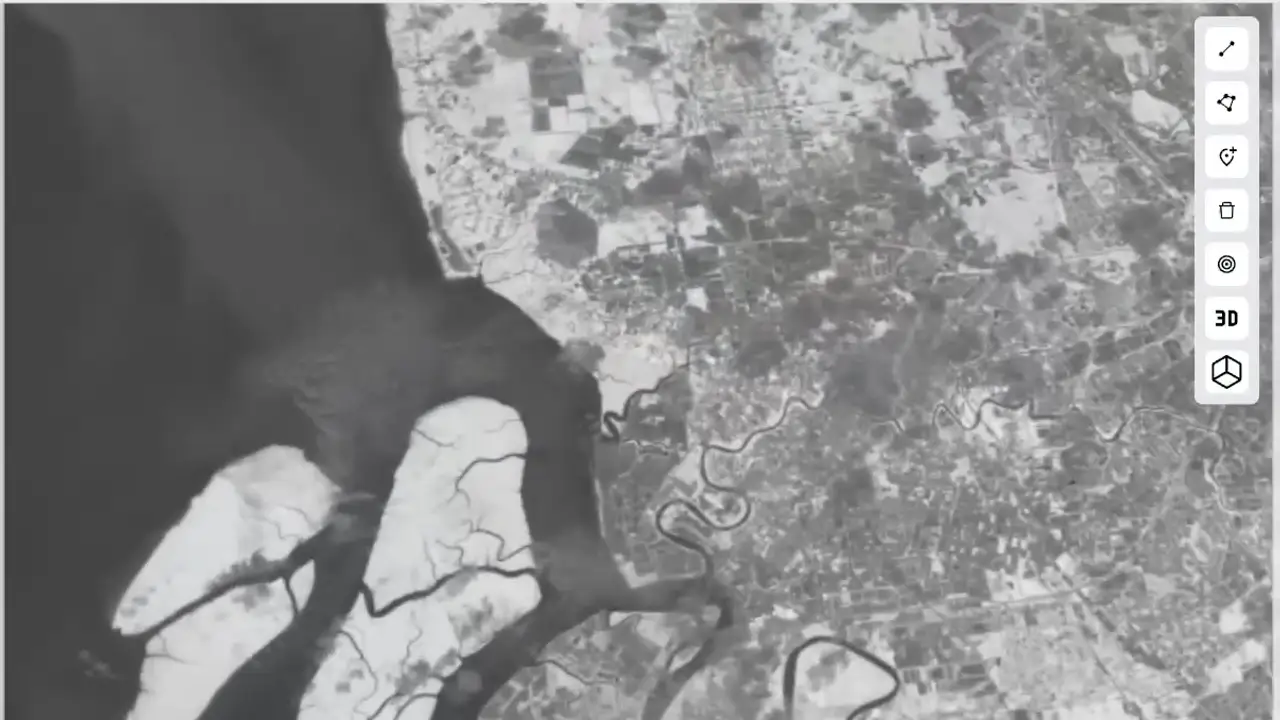
High-performance Cloud Optimized GeoTIFF visualization platform with dynamic geospatial layer management.
Enabled efficient streaming of large geospatial raster datasets. Improved GIS visualization performance for remote imagery. Reduced loading times using optimized cloud-native geospatial workflows. Enhanced user interaction with dynamic layer controls and overlays.
Large geospatial raster datasets are difficult to visualize efficiently on the web due to bandwidth, rendering, and scalability limitations. Traditional GIS systems struggle with interactive delivery of high-resolution satellite and terrain imagery.
Built a Cloud Optimized GeoTIFF (COG) visualization system integrated with MapLibre GL, enabling dynamic raster overlays, high-performance tile streaming, and interactive layer management directly within the browser.
The experience combines MapLibre, TypeScript, React, WebGL in a responsive system designed to stay clear, fast, and reliable across devices.
Enabled efficient streaming of large geospatial raster datasets. Improved GIS visualization performance for remote imagery. Reduced loading times using optimized cloud-native geospatial workflows. Enhanced user interaction with dynamic layer controls and overlays.
Spatial information is presented through an interactive map built for intuitive exploration.
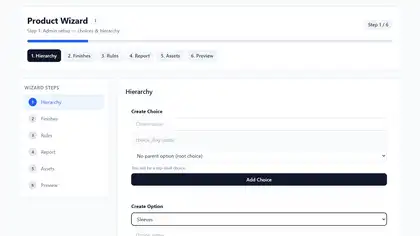
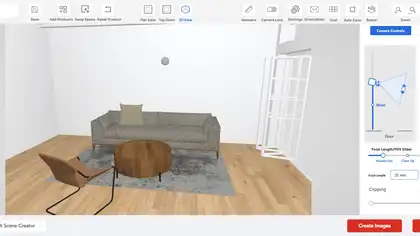
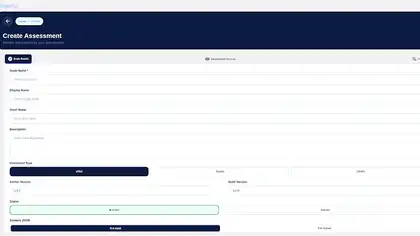
Structured forms simplify data collection and guide users through complete submission workflows.
The system runs in the browser, reducing setup friction across supported devices.
Enabled efficient streaming of large geospatial raster datasets. Improved GIS visualization performance for remote imagery. Reduced loading times using optimized cloud-native geospatial workflows. Enhanced user interaction with dynamic layer controls and overlays.
 Project TeamSaailverse case study
 Next ProjectAsset Movement Timeline SystemData Visualization