












Interactive mapping
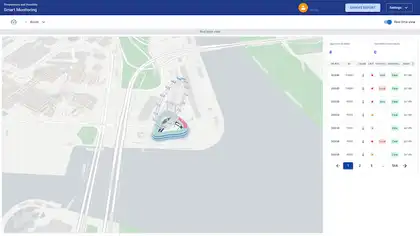
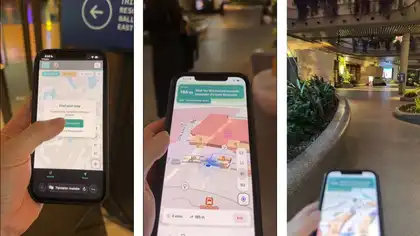
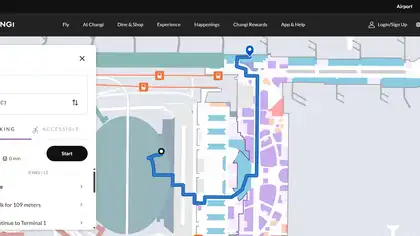
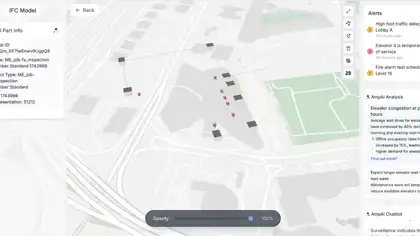
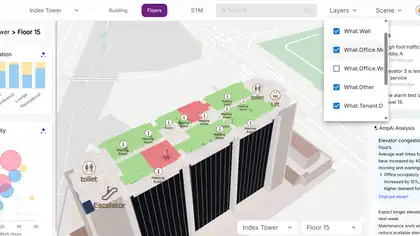
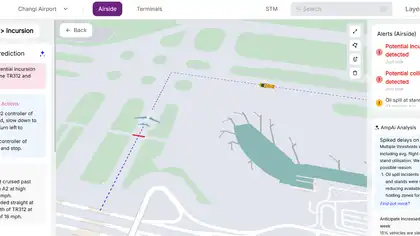
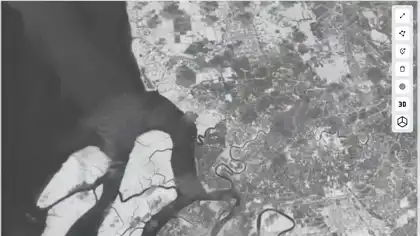
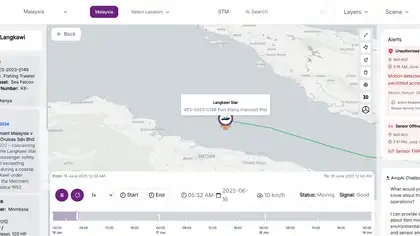
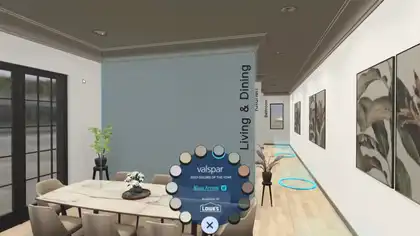
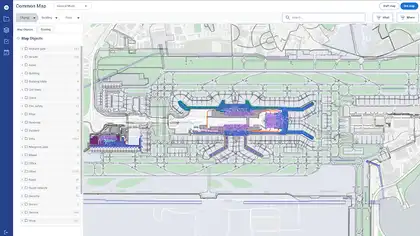
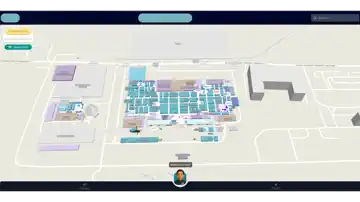
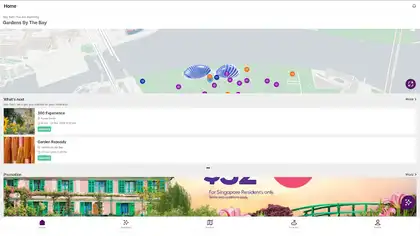
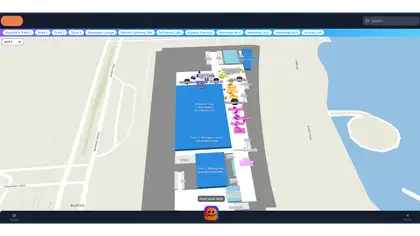
Spatial information is presented through an interactive map built for intuitive exploration.
Case study — Digital Experience
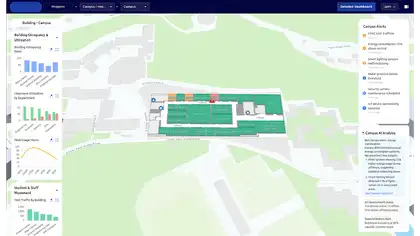
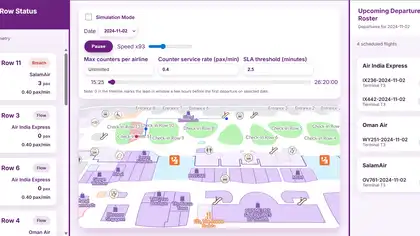
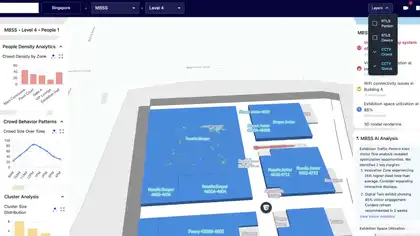
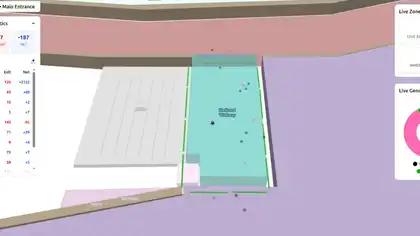
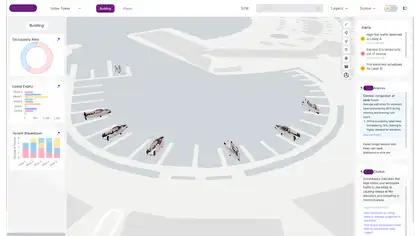
Real-time crowd density and queue monitoring visualization platform using geospatial heatmaps.
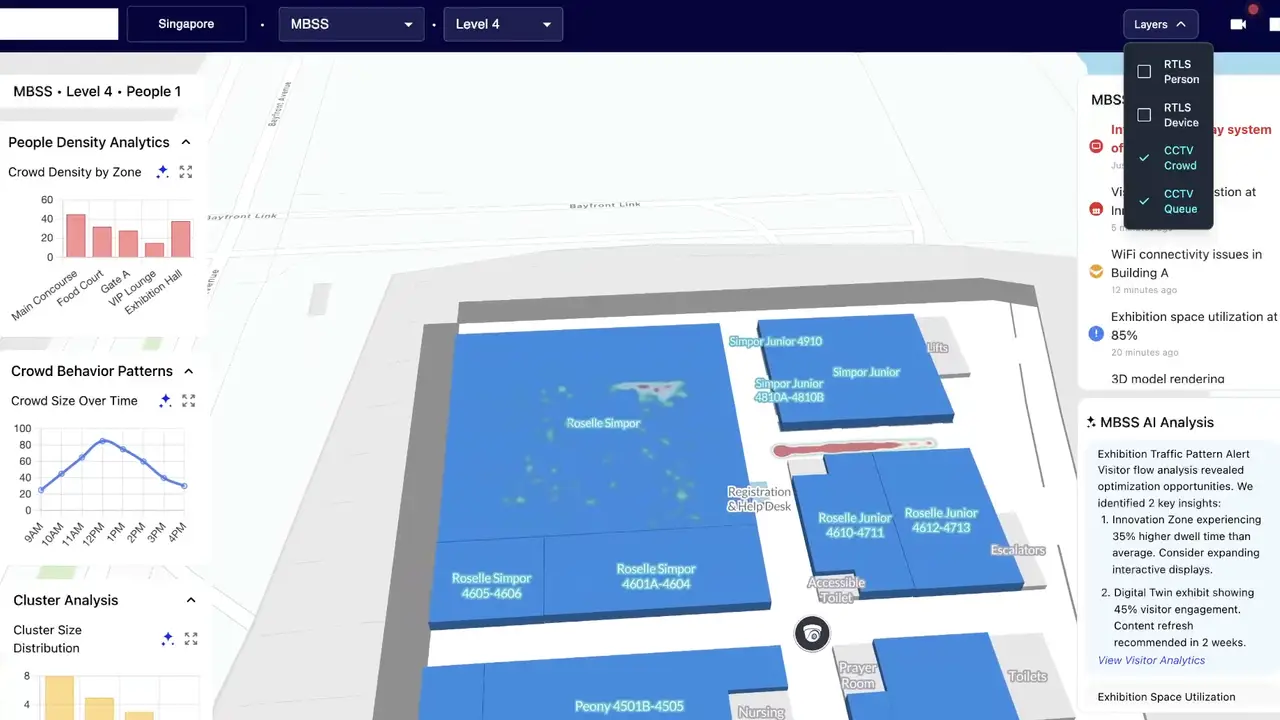
Real-time crowd density and queue monitoring visualization platform using geospatial heatmaps.
Improved operational visibility for crowd management. Enabled rapid identification of congestion hotspots. Enhanced spatial analytics for operational decision-making. Supported smarter resource allocation and operational response.
Monitoring crowd density and queue congestion in operational environments such as airports, malls, and public venues is difficult using traditional dashboards or static CCTV systems.
Built a real-time heatmap visualization system capable of displaying crowd density and queue congestion dynamically on interactive maps using geospatial analytics and heatmap rendering workflows.
The experience combines MapLibre, React, TypeScript, WebGL in a responsive system designed to stay clear, fast, and reliable across devices.
Improved operational visibility for crowd management. Enabled rapid identification of congestion hotspots. Enhanced spatial analytics for operational decision-making. Supported smarter resource allocation and operational response.
Spatial information is presented through an interactive map built for intuitive exploration.
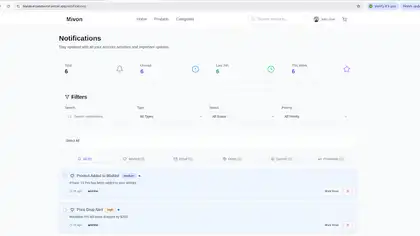
Live information keeps the experience current and supports timely decisions.
Operational dashboards turn system activity into clear, actionable insights.
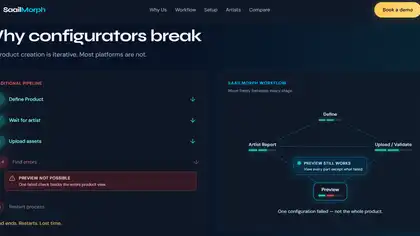
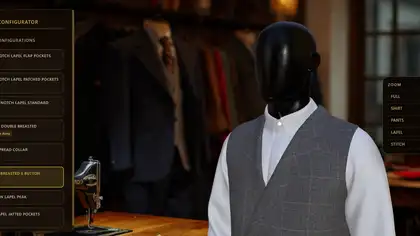
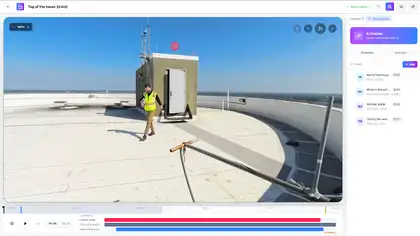
Guided workflows reduce repetitive work and keep complex processes consistent.
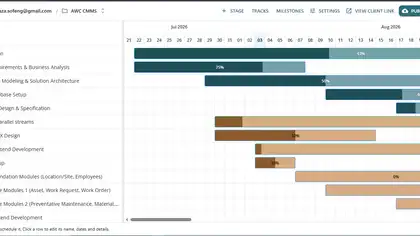
Clear visualizations turn complex data into information users can understand and act on.
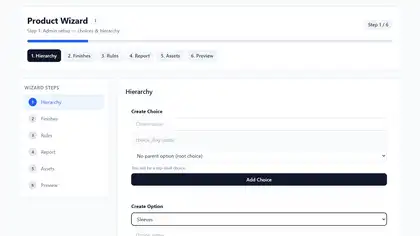
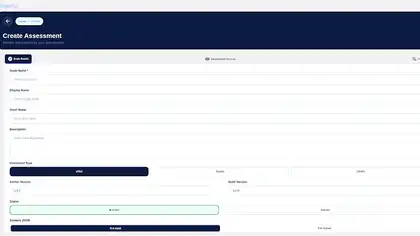
Structured forms simplify data collection and guide users through complete submission workflows.
Improved operational visibility for crowd management. Enabled rapid identification of congestion hotspots. Enhanced spatial analytics for operational decision-making. Supported smarter resource allocation and operational response.
 Project TeamSaailverse case study
 Next ProjectCollision Detection & Incursion Monitoring SystemData Visualization