











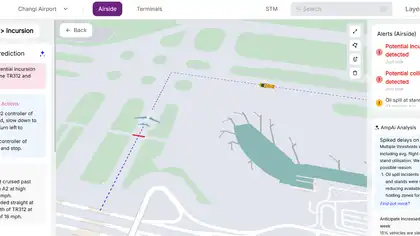
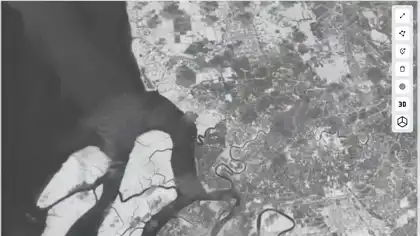
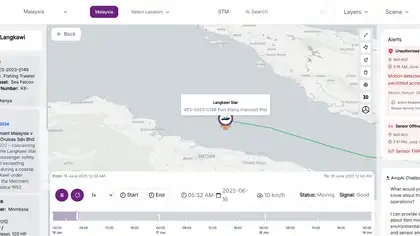
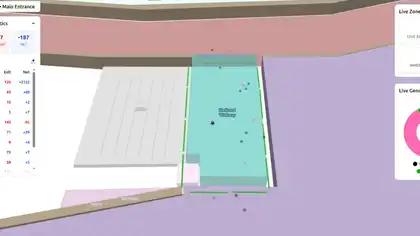


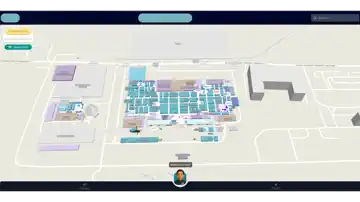
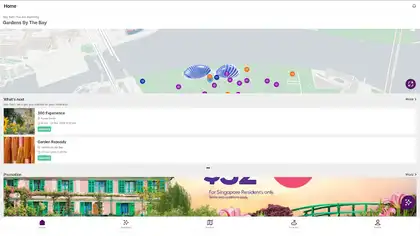
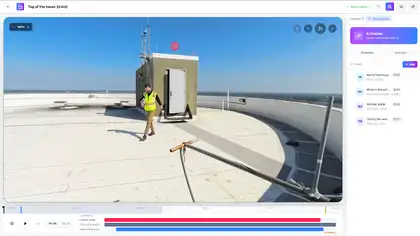
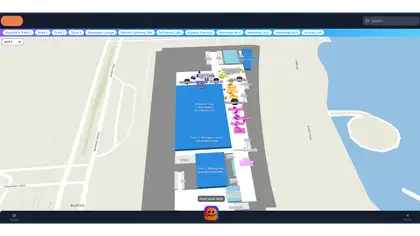
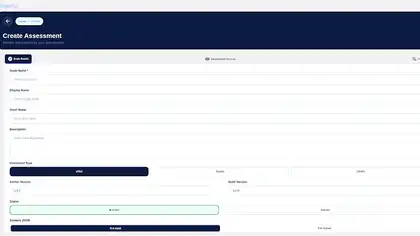
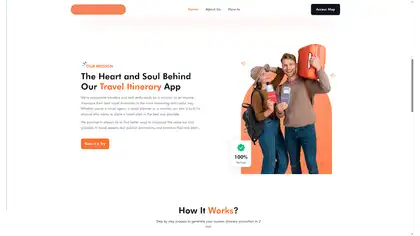

Interactive mapping
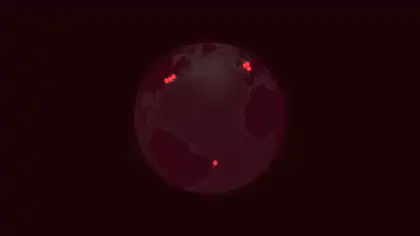
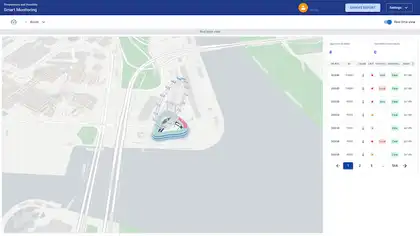
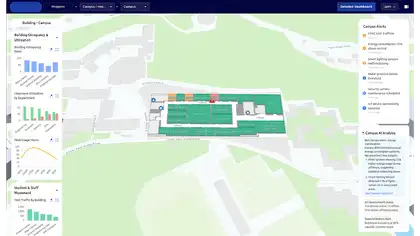
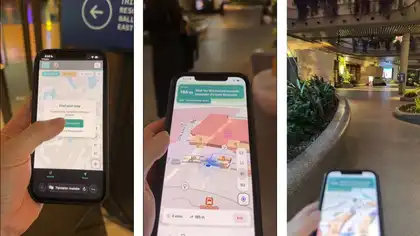
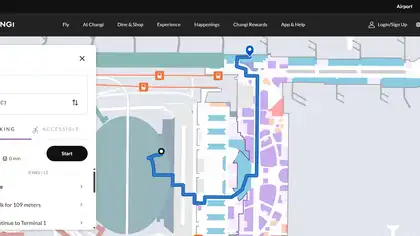
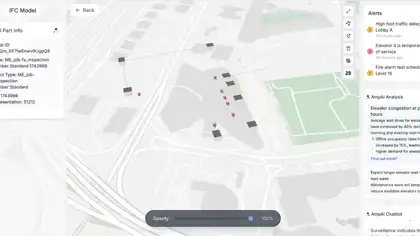
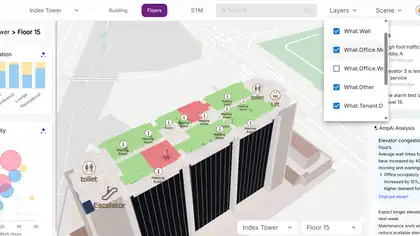
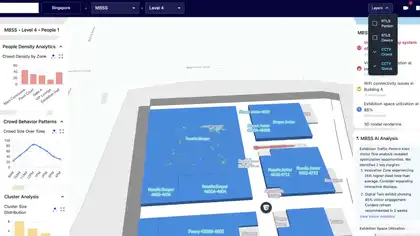
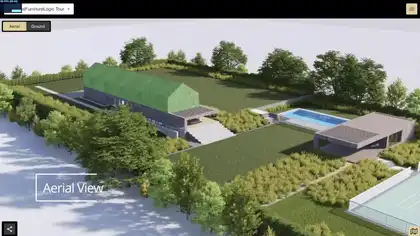
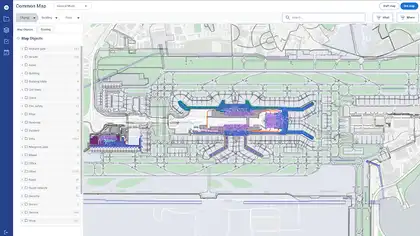
Spatial information is presented through an interactive map built for intuitive exploration.
Case study — Digital Experience
High-performance geospatial visualization engine combining Deck.GL with MapLibre GL.
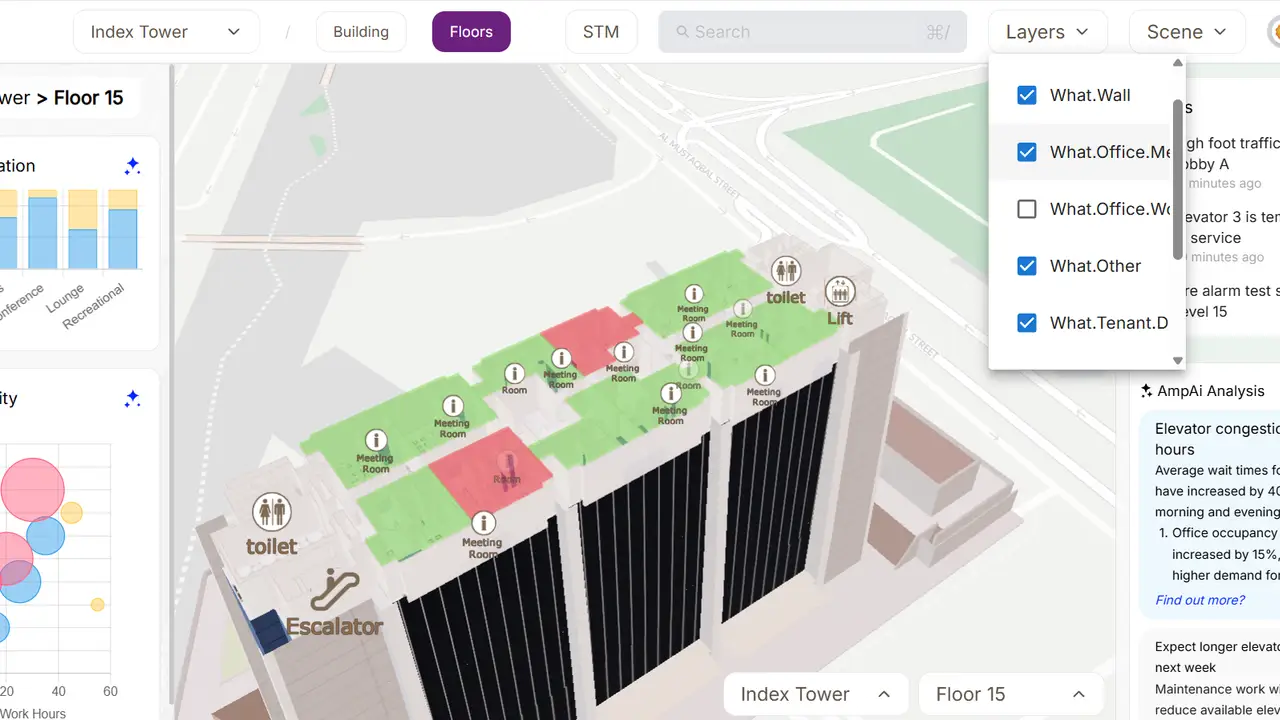
High-performance geospatial visualization engine combining Deck.GL with MapLibre GL.
Enabled high-performance rendering of large geospatial datasets. Improved visualization scalability for advanced GIS analytics. Supported seamless integration between Deck.GL and MapLibre. Enhanced rendering performance for browser-based geospatial systems.
Large-scale geospatial datasets are difficult to render interactively in browsers using traditional GIS visualization approaches, especially when handling 3D layers, combining different types of layers in combination or complex analytical visualisations.
Integrated a scalable Deck.GL visualization framework with MapLibre GL to enable high-performance rendering of advanced geospatial datasets, 3D layers, and analytical visualizations directly in the browser.
The experience combines Deck.GL, MapLibre, React, TypeScript in a responsive system designed to stay clear, fast, and reliable across devices.
Enabled high-performance rendering of large geospatial datasets. Improved visualization scalability for advanced GIS analytics. Supported seamless integration between Deck.GL and MapLibre. Enhanced rendering performance for browser-based geospatial systems.
Spatial information is presented through an interactive map built for intuitive exploration.
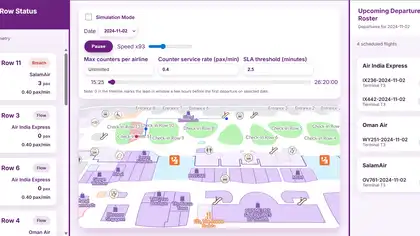
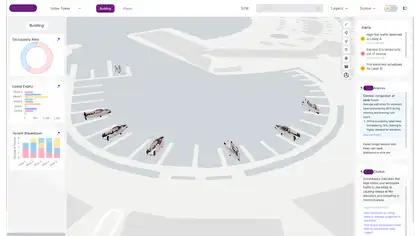
Operational dashboards turn system activity into clear, actionable insights.
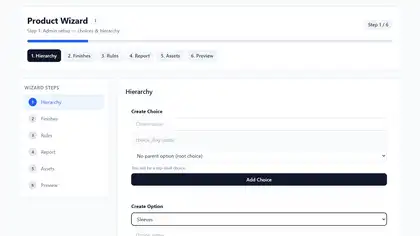
Structured forms simplify data collection and guide users through complete submission workflows.
The system runs in the browser, reducing setup friction across supported devices.
Monitoring is built into the system as a core user-facing capability.
Enabled high-performance rendering of large geospatial datasets. Improved visualization scalability for advanced GIS analytics. Supported seamless integration between Deck.GL and MapLibre. Enhanced rendering performance for browser-based geospatial systems.
 Project TeamSaailverse case study
 Next ProjectCrowd & Queue Heatmap Monitoring SystemData Visualization